The data, sources, and calculations used in the Animal Slaughter Interval in the U.S. infographic
Number Slaughtered, Total Live Weight, and Average Live Weight by Type and Month — United States: 2013 and 2014 Total Commodity Number slaughtered 2014 Total 2013 Total Chickens Young 8,522,427,000 8,503,750,000
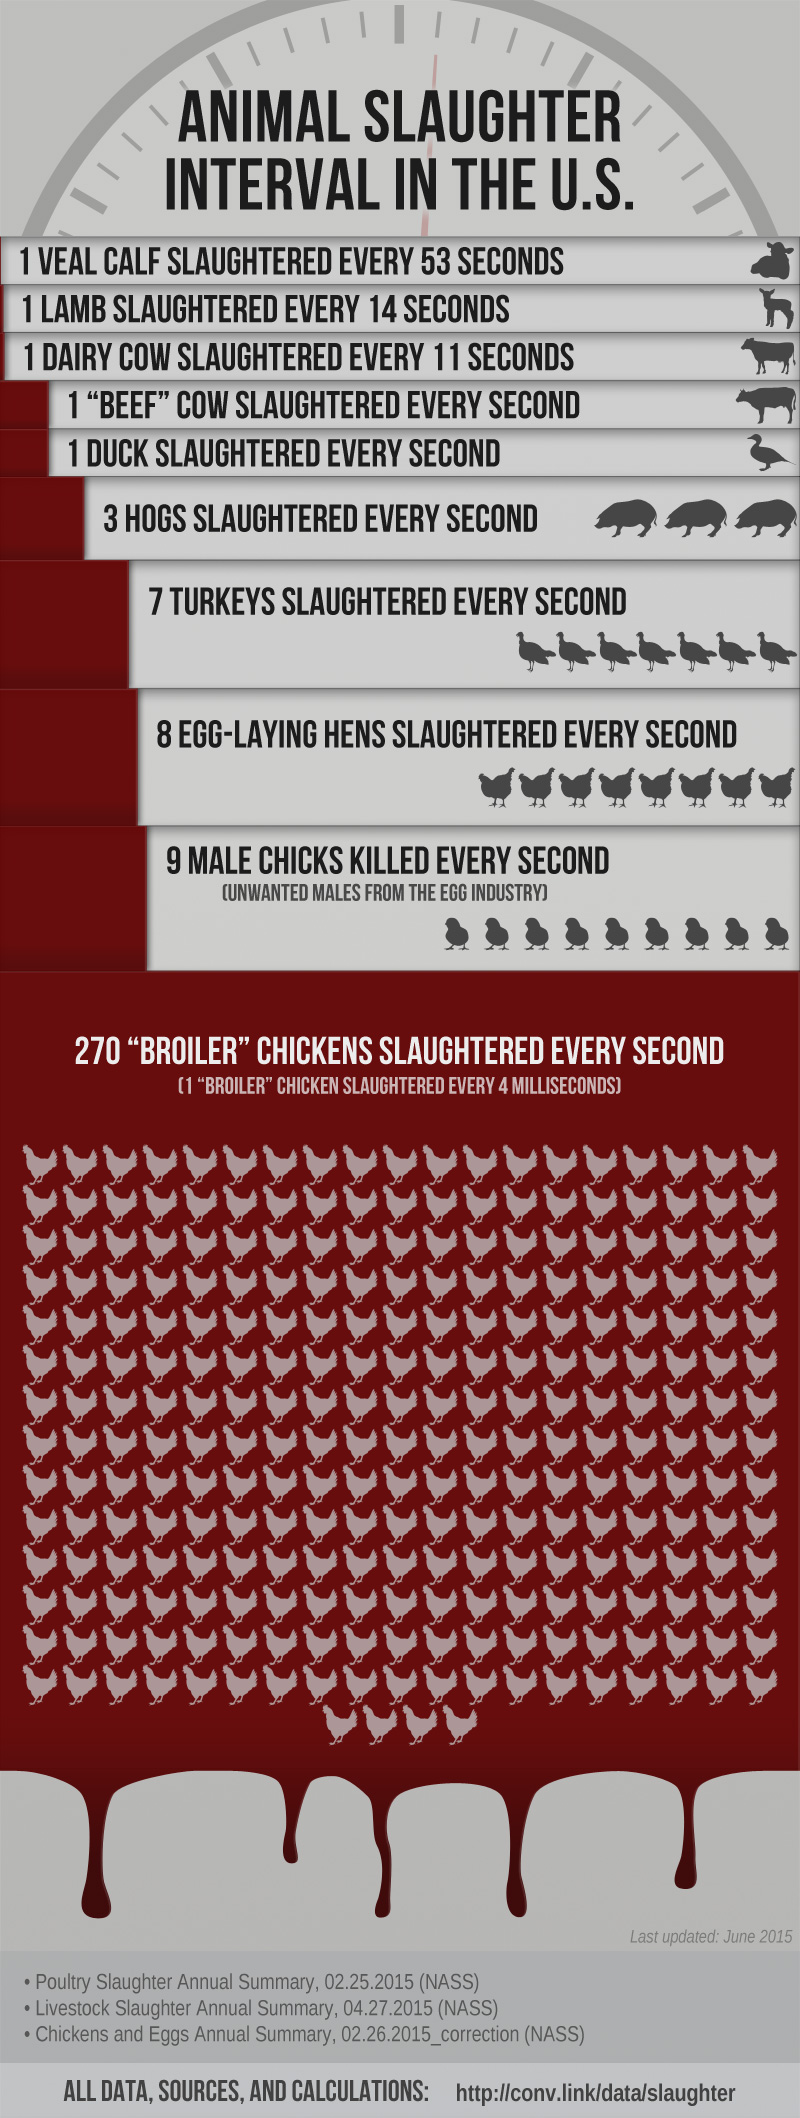
8,522,427,000 chickens/year * year/31,536,000 seconds = 270.24 chickens/second = 1 chicken/0.004 seconds
The calculations for male chicks culled per year can be found in Data: Problems Inherent In Egg Production
289,780,000 chicks/year * year/31,536,000 seconds = 9.19 chicks/second = 1 chick/0.109 seconds
Number Slaughtered, Lost, and Added During the Month — United States: 2013-2014 Month Layers sold for slaughter Layers rendered, died,
destroyed, composted, or
disappeared for any other reason
(other than sold)2013 2014 2013 2014 December 13,451,000 14,156,000 7,882,000 7,573,000 January 15,629,000 15,707,000 7,582,000 8,222,000 February 13,696,000 15,877,000 6,847,000 8,244,000 March 13,508,000 13,410,000 7,085,000 7,895,000 April 18,128,000 14,441,000 7,843,000 6,942,000 May 15,619,000 15,207,000 9,470,000 8,373,000 June 14,370,000 14,402,000 8,006,000 8,148,000 July 13,126,000 14,071,000 6,967,000 8,284,000 August 14,250,000 16,393,000 5,846,000 7,271,000 September 14,324,000 15,709,000 9,021,000 7,767,000 October 15,191,000 14,723,000 7,041,000 7,111,000 November 13,756,000 13,483,000 6,167,000 7,234,000
| Layers sold for slaughter | Layers rendered, died, destroyed, composted, or disappeared for any other reason (other than sold) | Total layers died for any reason | |||
|---|---|---|---|---|---|
| 2013 | 2014 | 2013 | 2014 | 2013 | 2014 |
| 175,048,000 | 177,579,000 | 89,757,000 | 93,064,000 | 264,805,000 | 270,643,000 |
270,643,000 hens/year * year/31,536,000 seconds = 8.58 hens/second = 1 hen/0.117 seconds
Number Slaughtered, Total Live Weight, and Average Live Weight by Type and Month — United States: 2013 and 2014 Total Commodity Number slaughtered 2014 Total 2013 Total Turkeys 236,617,000 239,404,000
236,617,000 turkeys/year * year/31,536,000 seconds = 7.50 turkeys/second = 1 turkey/0.133 seconds
Commerical and Farm, Number of Head Slaughtered By Species — United States: 2013 and 2014 Species Total slaughter 2013 2014 Hogs 112,160,500 106,957,700
106,957,700 hogs/year * year/31,536,000 seconds = 3.39 hogs/second = 1 hog/0.295 seconds
Number Slaughtered, Total Live Weight, and Average Live Weight by Type and Month — United States: 2013 and 2014 Total Commodity Number slaughtered 2014 Total 2013 Total Ducks 26,368,000 24,575,000
26,368,000 ducks/year * year/31,536,000 seconds = 0.84 ducks/second = 1 duck/1.196 seconds
Commerical and Farm, Number of Head Slaughtered By Species — United States: 2013 and 2014 Species Total slaughter 2013 2014 Cattle 32,564,800 30,268,300 Calves 787,700 591,300
Federally Inspected Number of Head Slaughtered and Percent by Classification and Month — United States: 2014 and 2013 Total Classification 2014 Total 2013 Total Cattle Dairy cows 2,815,600 3,124,900 Calves and vealers 557,600 751,000 Total 29,684,100 31,947,000
29,684,100 federally inspected cattle slaughtered - 557,600 federally inspected veal calves slaughtered = 29,126,500 federally inspected non-calf cattle slaughtered
2,815,600 federally inspected dairy cows slaughtered/29,126,500 federally inspected non-calf cattle slaughtered = 0.09667
0.09667 * 30,268,300 non-calf cattle slaughtered = 2,925,975 dairy cows slaughtered
30,268,300 non-calf cattle slaughtered - 2,925,975 dairy cows slaughtered = 27,342,325 beef cattle slaughtered
2,925,975 cows/year * year/31,536,000 seconds = 0.09 cows/second = 1 cow/10.778 seconds
27,342,325 head cattle/year * year/31,536,000 seconds = 0.87 head cattle/second = 1 head cattle/1.153 seconds
591,300 calves/year * year/31,536,000 seconds = 0.02 calves/second = 1 calf/53.333 seconds
Commerical and Farm, Number of Head Slaughtered By Species — United States: 2013 and 2014 Species Total slaughter 2013 2014 Sheep 2,412,200 2,404,000
Federally Inspected Number of Head Slaughtered and Percent by Classification and Month — United States: 2014 and 2013 Total Classification 2014 Total 2013 Total Sheep Mature sheep 136,300 132,600 Lambs and yearlings 1,968,000 1,987,600 Total 2,104,400 2,120,100
1,968,000 federally inspected lambs slaughtered/2,104,400 federally inspected sheep slaughtered = 0.93518
0.93518 * 2,404,000 sheep slaughtered = 2,248,180 lambs slaughtered
2,248,180 lambs/year * year/31,536,000 seconds = 0.07 lambs/second = 1 lamb/14.027 seconds